
New features 2026 Series - Electrical grid calculation
Electro Graphics releases the latest 2026 Series of electrical and photovoltaic design software. Here are the most important features and enhancements introduced about Electrical grid calculation in the software Ampère line and EGlink.


See all new features 2026:
Download brochure Electro Graphics New features 2026
Improved interface and operating speed
The Ampère 2026 line provides enhanced performance for increasingly complex projects.
The continuous evolution of the software, which culminated in Ampère Evolution and the dedicated load flow models, has led to a significant increase in available functionality and verification. At the same time, the size of projects has grown exponentially - think of photovoltaic power plants of tens of megawatts.
To meet these challenges and ensure an increasingly smooth user experience, we have focused our efforts on performance optimisation.
• Optimal utilisation of hardware resources: the 2026 line was designed to maximise the use of multi-core processors, allowing complex calculations to be performed in parallel and drastically reducing processing times.
• State-of-the-art algorithms: we have implemented algorithms with computational complexity O(nlogn), guaranteeing excellent performance even for large grid sizes.
• Targeted optimisation: Ampère internal algorithms have been carefully optimised for different types of networks, with a focus on calculating faults, voltage drops and load flow.
Thanks to these innovations, the fourth option (multi-thread O(nlogn) complexity) offers a significant performance improvement for a wide range of applications.
Improved interface: start page
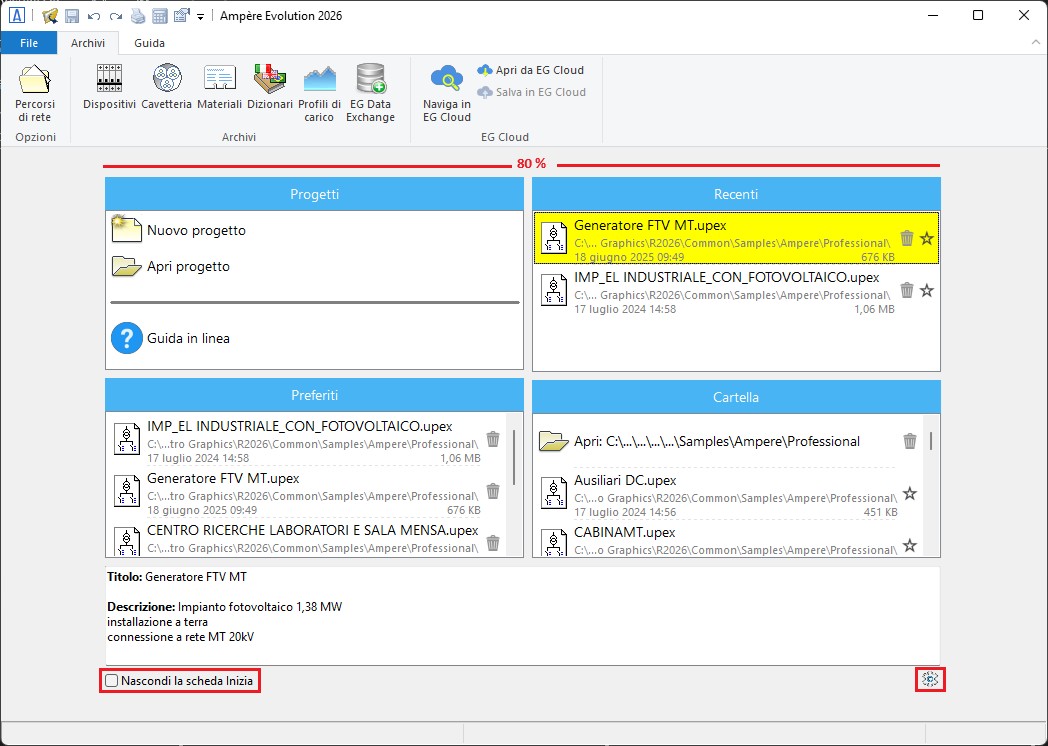
The start page displays the lists of project files divided into Favorites, Recent, and Selected Folder. The new Options command, accessible through the button at the bottom right, lists several new features.
Setup
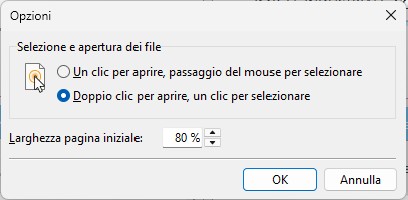
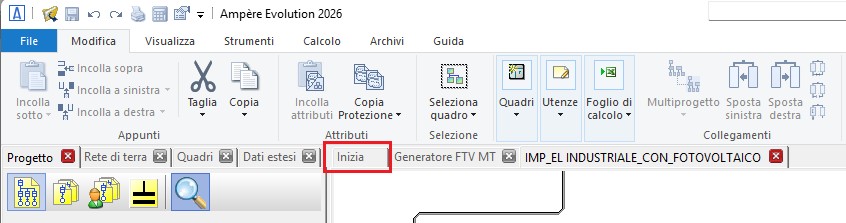
The first tab, named Start, allows viewing the start page without closing the open projects.In the file list of the three panels (Recent, Favorites, Folder), open projects are highlighted with the pencil icon.Open a project to return to design mode.
Grounding network
The software introduces a new manager within its proprietary CAD environment to define the grounding network, which may consist of various basic elements. It belongs to the Advanced Features group, featuring a side panel equipped with a toolbar.
The panel allows creating the network using two modes:
DWG drawing mode, offering full management of the DWG drawing with all elements representable in a scaled floor plan, including reusable base objects (earth electrodes, cables, Petersen coils, and collectors) of the electrical network.
Classic mode, without graphical representation, composed of discrete elements such as earth electrodes, cables, Petersen coils, and collectors, without an associated drawing.
The software also performs calculation of the maximum fault current that may flow through the elements of the grounding network and verifies cables based on the specific energy they can withstand.
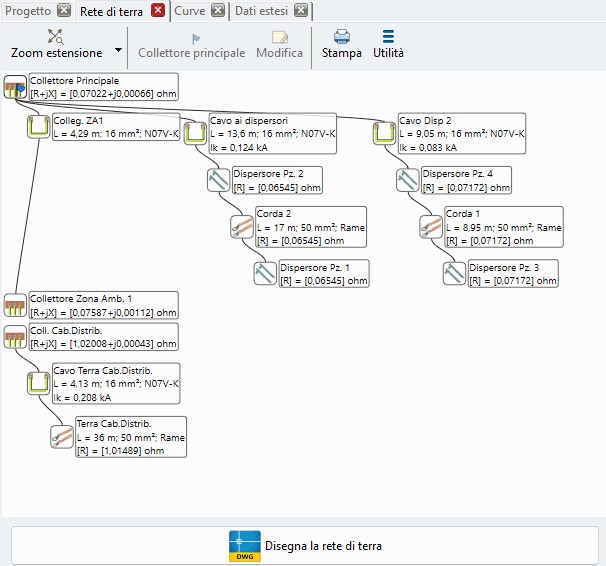
The new Grounding Network panel displays the network as in the following example, with at the bottom the Draw the grounding network command, which opens the actual drawing manager in a CAD sheet, allowing the design and drawing of the grounding network of the electrical system while providing the essential functions for defining the objects that compose the network and for arranging and interconnecting them in the system drawing/plan.
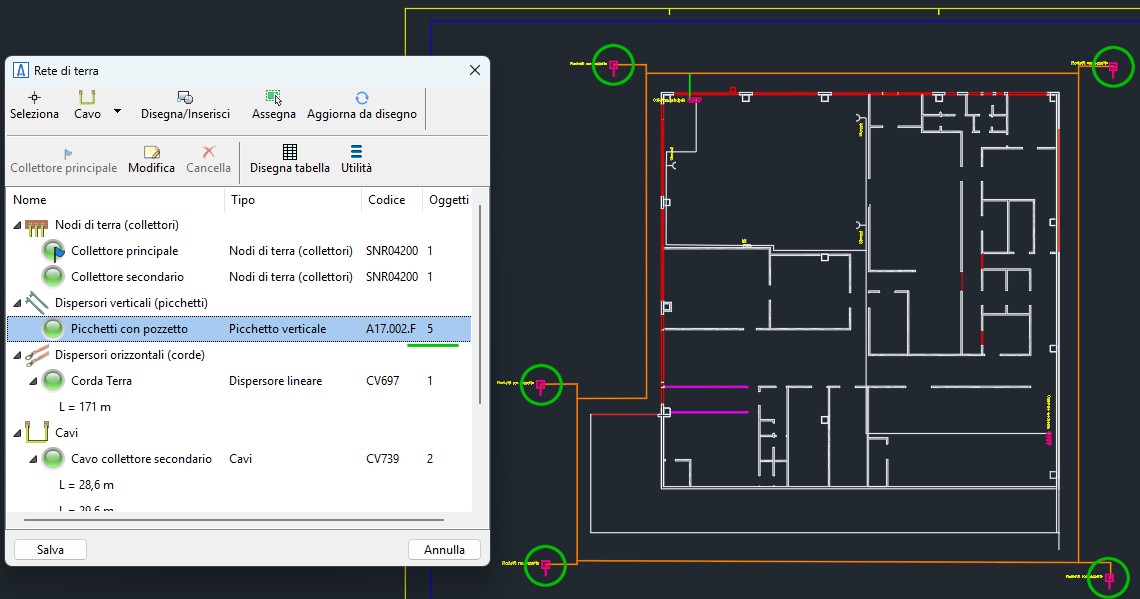
Creation and modification of grounding network objects
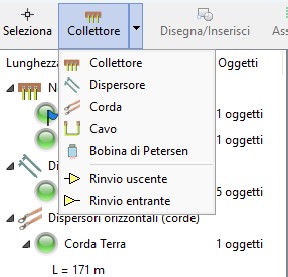
To insert a new object into the list, open the corresponding menu in the toolbar and select the object type:
• Collector
• Earth electrode
• Conductor
• Cable
• Petersen coil
When the insertion command starts, the dialog window allows defining the properties of the new object. Confirm the data with OK or select Cancel to end the command.
When the data is confirmed, the drawing command for the new object is launched.
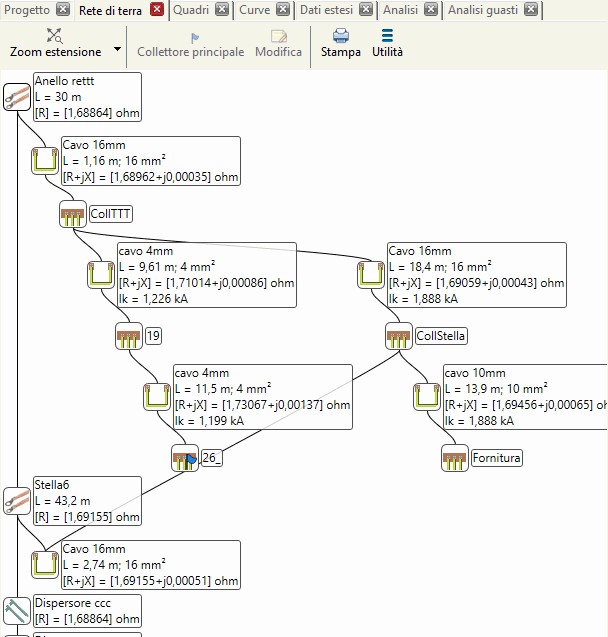
Calculation of fault currents in grounding conductors
Starting from the values of single-phase-to-earth and two-phase-to-earth fault currents determined at the points where the loads connect to the collectors, the software propagates these currents along the grounding network, calculating the path and magnitude of each current through all elements and recording the maximum values to be used in the verification process.
ChatGPT ha detto:
Verification of conductors using the passing-energy criterion K²S²
The cables defined in the Grounding Network are verified with respect to the passing energy of the protective devices that safeguard them. The software performs the same checks used for network and PE cables, applying them to grounding cables. Since managing grounding cables is simpler than managing those defined in a load, some parameters are assigned default characteristics to determine the current-carrying capacity Iz of the cables:
• single-core buried installation type D2 according to IEC 60364-5-52 Ed. 3, with arrangement in air;
• insulation set to EPR.
If the verification is not satisfied, the notification appears in the Grounding Network panel, among the data displayed for each element of the network, using a message and an alert symbol.
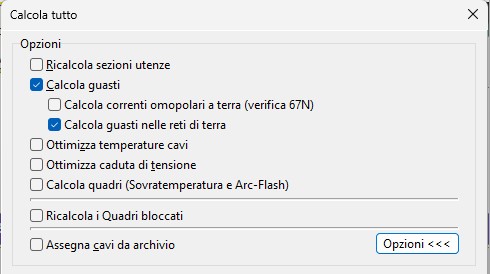
Note. The calculation of fault currents through the grounding network is computationally heavy because an equivalent network is modeled that includes both phase and earth conductors; moreover, calculations are repeated multiple times to identify the worst-case scenarios.
Three-to-single-phase transformer
When there is a need to supply large single-phase loads without creating significant unbalance upstream in the three-phase supply network, a simple and cost-effective solution is the three-to-single-phase transformer. In addition to load balancing, a three-to-single-phase transformer provides electrical isolation, ensuring galvanic separation between the three-phase network and the single-phase load, thereby improving system safety and protection.
The software allows defining a three-to-single-phase transformer so that a single-phase system can be derived from a three-phase one while maintaining reasonable current balance in the source network. The distribution of currents in the three-phase system follows the ratio 1–2–1; in this case, one of the three lines carries twice the current of the others.
This situation is preferable to the use of a normal three-phase transformer, which would result in a primary-side current distribution with a 1–1–0 ratio, leaving one phase completely unloaded and causing greater system imbalance.
Two distinct configurations of three-to-single-phase transformers are possible.
The first uses the coupling of two primary windings to obtain single-phase voltage and current from three-phase quantities; the second configuration instead uses the coupling of three primary windings to achieve the same purpose.
SPD verification
SPD management has been updated by adding the verifications required by CEI 64-8, 2024 edition, section 534.
The software reports cases that do not meet the applied criteria as warnings (yellow error).
The selection of SPDs to install must be based particularly on the following parameters:
• the voltage protection level (UP) and nominal impulse withstand voltage (UW);
• the nominal discharge current (In) and the impulse discharge current (Iimp);
• the nominal follow current interruption capability.
Note. The SPD parameters subject to verification are compared with the characteristics of the loads belonging to the same panel as the surge protective device.
Protection voltage check
To assist with proper SPD selection, Ampère checks that the SPD protection voltage UP and the impulse withstand voltage UW of the equipment to be protected meet the conditions required by CEI 64-8.
This verification is applied differently depending on whether the network is AC or DC, and on the distance introduced by the branch connection where the SPD is installed.
The verification refers to Table 534.1 of CEI 64-8/5 to determine the impulse withstand voltage UW.
The standard recommends that the SPD protection level UP should not exceed 80% of the nominal impulse withstand voltage required for the equipment indicated in the table, which corresponds to overvoltage category II.
Panel creation
The software expands the ability to create new panels. In the past, panels were always required to have at least one load defined and assigned to them.
The new Create a new panel command, available in the Panels section of the Advanced Features, allows creating a panel as an empty container, with a name, enclosure, and related information.
It will have no loads assigned initially, which can be added later, and it simplifies initial mesh creation or splitting an existing panel into two.
When opening the Edit Load window, under the Load tab, the new panel will appear in the Panel list, with the change applied immediately after confirming with OK.
If during mesh creation operations a panel temporarily ends up without loads (for example after cut-and-paste operations), it is not lost but instead placed in the Unassigned Panels list, so it can be reused later.
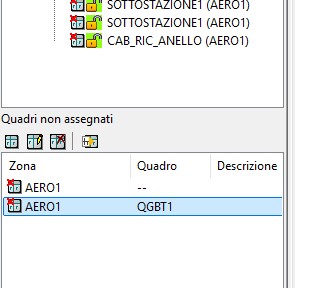
The Delete command removes the panel from the list.
The Assign panel to selected loads command is the key function that easily assigns the panel selected in the Unassigned Panels box to the loads selected in the mesh.
Ampère Professional / Evolution: association of P/Q curves by points to network elements
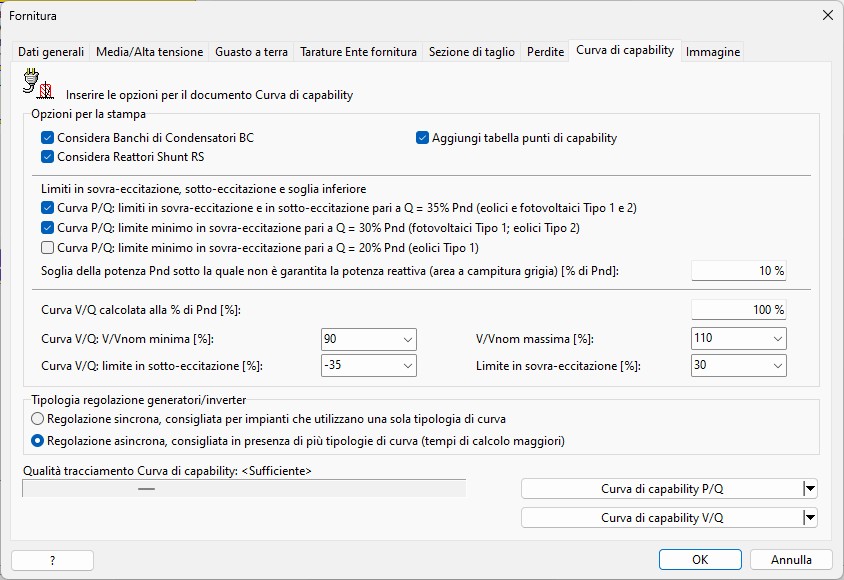
The main interface has been redesigned, with commands reorganized into four horizontal sections:
• printing options at the top
• options for the P/Q curve
• options for the V/Q curve (Ampère Evolution only)
• plotting commands
The most significant changes were made to the V/Q capability curve, which can now handle parametric voltage curves provided by generator/inverter manufacturers, enabling proper analysis as voltage varies.
The second major improvement is the ability to export results (operating points) to a spreadsheet or directly to Excel, allowing designers to perform further processing.
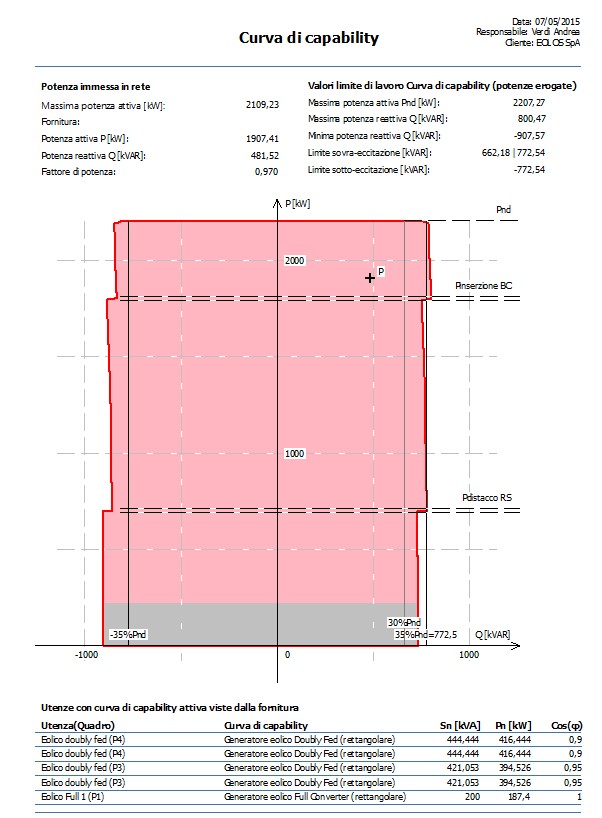
The printing of the P/Q capability curve has been revised by reorganizing the main information at the supply level and for the generators involved. The under- and over-excitation limits are now shown, making it easy to compare them with the exchanged reactive power. The generator data reports the apparent power and the important active power, which corresponds to the regulation power.
ChatGPT ha detto:
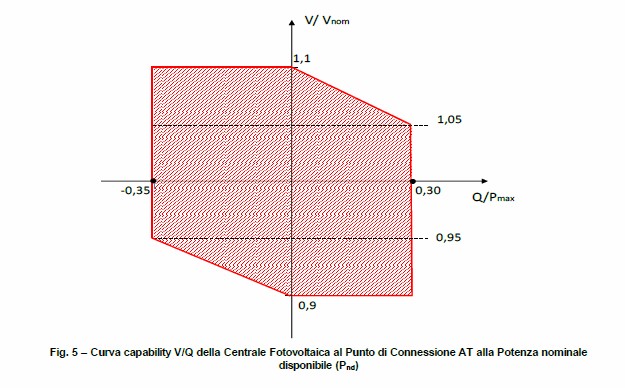
Ampère Evolution also calculates the V/Q capability curve, which provides the range of Q/Pnd that the generation plant can supply to the grid as the supply voltage varies.
To ensure grid stability, generators must not only be able to produce active power—it is essential that they also supply the reactive power required by the grid.
Using as a reference the maximum power Pnd produced at nominal voltage Vn, the graph shows the plant’s ability to deliver, as voltage varies, the reactive power in both under-excitation and over-excitation, with the limits shown in the figure.
Ampère Script
Ampère Evolution provides the Ampère Script tool, which enables automation of tasks using a programming language with Pascal-like syntax, enhanced with additional commands that allow users to employ Ampère’s internal functions and extend them for specific purposes.
Automation algorithms can be applied at various stages of project development.
During the initial phase, panels with similar and predictable characteristics can be created and initialized according to parameters defined by the client or general design criteria.
During the fine-tuning phase, dedicated algorithms can help the designer find optimal solutions by repeating calculation cycles while modifying sets of parameters.
In the documentation phase, custom outputs can be generated to perform specific calculations or checks on certain parts of the project.
Creativity, technical skills, teamwork, and reusability make it possible over time to build script code libraries that add significant value to the designer’s work.
Console interface
The script file archive is available in the ribbon under the Tools page, Properties group, via the Ampère Script command.
The manager interface is divided into 5 sections:
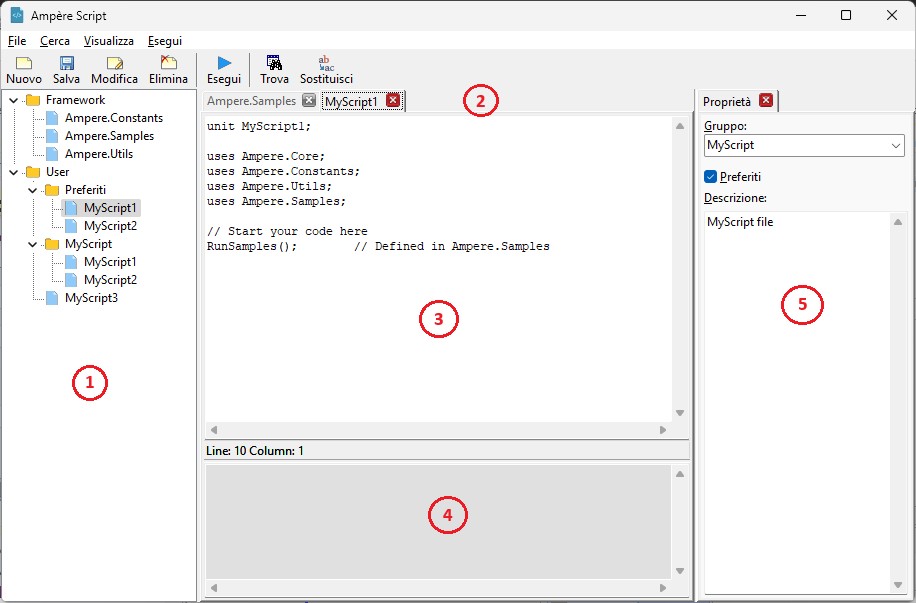
1. Tree structure of the files;2. List of tabs of the open files;3. Editor of the selected file;4. Status or warning messages;5. General properties of the selected file.
The New command assigns a name, group, and Favorites option to the new script file, which will be added to the tree structure.
The Run command executes the instructions contained in the current file. Status messages, errors, or malfunctions are shown in the bottom panel.Each new file is pre-filled with the code required to execute the functions.
Some example functions are already available.

EGlink: interoperability Revit© MEP – Ampère Pro/Evo
EGlink is an exchange plugin between Autodesk Revit and Ampère Pro/Evo and represents Electro Graphics’ response to the BIM (Building Information Modeling) philosophy.
Extension of functions and adaptation to Revit 2026
EGlink 2026 is compatible with Autodesk Revit from version 2022 to version 2026.
See all new features 2026:
Download brochure Electro Graphics New features 2026